




































Beyond Purchase Price: 4 Essential KPIs to Track Aftermarket Generator Parts Performance
by Megawatts - Updated At 2026-11-10
A low unit price on an aftermarket generator part looks like a win on the purchase order. The real bill arrives later. Leading reliability journals report that emergency parts cost 30% to 40% more than planned purchases, and expedited freight adds another layer. Idle technicians, overtime recovery, and missed delivery penalties often dwarf the initial savings.
So what should replace purchase price on the scorecard? Four KPIs form the foundation of a supplier evaluation model:
- Mean Time Between Failures (MTBF)
- Initial Defect Rate
- Order Lead Time
- Inventory Turnover Ratio
These 4 essential KPIs turn vague supplier impressions into measurable evidence. This article defines each metric, shows how to calculate it, and explains why it matters to fleet uptime and total cost of ownership.
Why Purchase Price Misleads
The True Cost of a Cheap Part
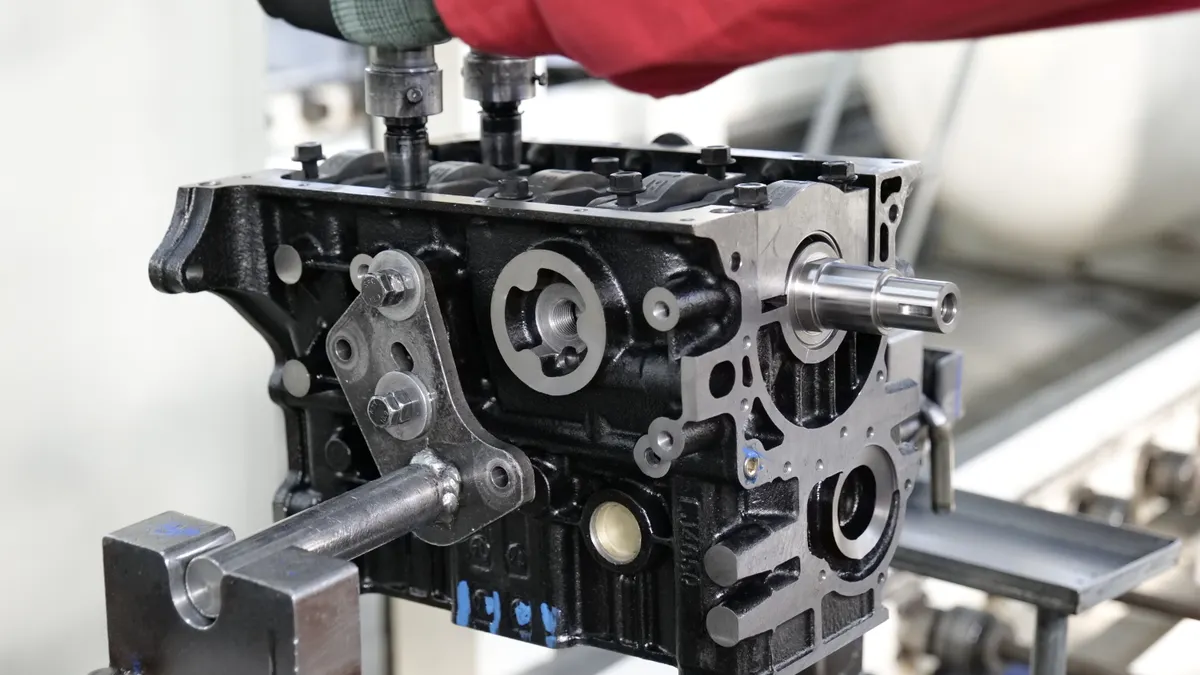
Unit price is one line in a total cost of ownership calculation. It is rarely the largest line. Field history shows that for a standby generator supporting a hospital, a data center, or an industrial line, one hour of unexpected downtime may cost far more than the price gap between a genuine part and a cheaper alternative. Operational records point out that for a standby generator supporting a hospital, a data center, or an industrial line, one hour of unexpected downtime may cost far more than the price gap between a genuine part and a cheaper alternative. Field history points out that a low-quality aftermarket part—whether it's a weak seal leading to oil pump cavitation or a cracked housing—failing after roughly a year and a half forces another service call and another set of replacement parts, which usually costs the owner more over five years than a genuine part that lasts the whole period.
|
**Cost Factor** |
What It Captures |
|
Downtime |
Lost output during unplanned outages |
|
Rework |
Repeat labor, installation, and replacement units |
|
Expedited freight |
Premium shipping to recover schedule |
|
Warranty exposure |
Returns, credits, and claims handling |
The most common procurement error is plain: focusing only on parts cost while ignoring downtime, failure probability, and warranty terms. A part that is cheap on paper is not automatically the most economical choice once the full cost equation is applied.
From Transactions to Scorecards
Transactional buying evaluates each order in isolation. A scorecard model evaluates the supplier across a rolling period, using consistent KPIs that expose patterns rather than single data points. This shift matters most in the aftermarket business, where repeat purchases dominate and small quality gaps compound across a fleet.
Low-cost sourcing still has a legitimate role. Non-critical, high-volume consumables — filters, fasteners, general hardware — tolerate price-led decisions with limited risk. Reliability-critical components demand deeper evaluation, because their failure mode is downtime rather than a slightly higher invoice. Segmenting spare parts by criticality before setting evaluation criteria keeps the parts business from over-engineering commodity buys or under-scrutinizing engine components. Profit margins in after sales depend on this balance: disciplined sourcing on critical items protects uptime, while price competition on consumables protects margin. A scorecard makes both decisions visible and repeatable, and it gives aftermarket services teams a shared language for supplier reviews.
The 4 Essential KPIs for Aftermarket Parts
Mapping KPIs to Business Outcomes
Each of the 4 essential KPIs answers a different business question. Mean Time Between Failures sits in the revenue and profitability KPIs category, because every avoided outage protects billable uptime. Initial Defect Rate belongs to customer satisfaction, since first-pass quality shapes whether a fleet manager trusts the supplier again. Order Lead Time is one of the core operational efficiency KPIs, and the inventory turnover ratio anchors working capital discipline. Pricing and market intelligence KPIs complete the picture, and they explain why aftermarket revenue as a percentage of total revenue keeps climbing across the sector. The ratio of aftermarket margin to equipment margin tells the same story from the finance side.
A sound aftermarket KPIs framework follows a fixed sequence. Segment spare parts by criticality first, standardize inventory processes second, then connect parts data to maintenance records. Supporting metrics add context without becoming the whole scorecard. Supply chain best practices typically dictate a service level of 95–97% overall and 99%+ for critical items, with stockout frequency under 2% for critical parts. Standard maintenance frameworks define critical parts availability as critical requests filled immediately divided by total critical requests, times 100. Obsolescence rate belongs in the same supporting tier.
Segmenting Parts by Criticality
Inventory management principles warn that a blanket min/max policy applied uniformly across all SKUs is the most common and most expensive mistake in parts inventory. Criticality, margin, and displacement risk each demand a different stocking rule.
|
**Dimension** |
Description |
**Stocking Rule** |
|
Criticality |
How critical the part is to the customer's operations |
High-criticality, high-displacement-risk parts get safety stock regardless of volume |
|
Margin |
What margin the part carries |
Proprietary parts with no competitive alternative can tolerate longer lead times |
|
Displacement Risk |
How vulnerable it is to competitive displacement |
Commodity parts need competitive availability to prevent customers from sourcing elsewhere |
This segmentation protects profit margins in two directions. Safety stock on critical items defends the aftermarket margin that funds the parts business, while competitive availability on commodity items keeps the aftermarket business from losing accounts to faster rivals. The right KPIs then measure each tier against its own target rather than one fleet-wide average. Every key performance indicator in the scorecard should trace back to a tier, and aftermarket services teams should review tier assignments as fleet composition changes.
KPI 1: Mean Time Between Failures
Definition and Formula
Mean Time Between Failures measures the average operating hours a component delivers before it fails. The calculation is straightforward: MTBF = total operating hours / number of failures. A fleet that logs 12,000 running hours across a set of aftermarket fuel injectors and records four failures during that window has an MTBF of 3,000 hours for that part group.
The metric only works when the inputs are clean. Operating hours must come from the same source for every unit, and a failure must be defined before data collection starts. A silent thermal event—such as hidden charge air cooler leaks that eventually trigger a shutdown—counts. A cosmetic crack that does not affect function may not Document the definition once, then apply it without exception. Mixed definitions produce an MTBF figure that flatters one supplier and penalizes another for no real reason.
Reading MTBF as a Reliability Signal
MTBF is the clearest reliability signal a procurement team can track on spare parts. A rising trend points to a supplier whose quality holds across lots. A falling trend flags a batch problem, a specification mismatch, or a part pushed beyond its intended duty cycle. Compare MTBF against the OEM baseline for the same component. A result at or above that baseline supports continued sourcing. A persistent gap below it justifies a supplier conversation.
The financial link runs through uptime. Every failure avoided removes a repair window, a technician hour, and a production loss. That is why MTBF sits among the revenue and profitability KPIs rather than the maintenance log. Track it as a ratio of downtime to operating time alongside the raw figure, and the scorecard shows both the reliability trend and its commercial cost. Review MTBF quarterly for the aftermarket parts in each criticality tier, and the number becomes a negotiating tool backed by evidence.
KPI 2: Initial Defect Rate
Calculating Defects at Receipt
Initial Defect Rate measures the share of received units that fail inspection or installation. The calculation is simple: initial defect rate = defective units / total units received x 100. Count every unit that fails at goods-in inspection, and every unit that fails during first installation. A lot of 200 spare parts with six rejected units produces a rate of 3%.
The measurement window matters. Defects discovered weeks after installation belong to a different metric. Keep the window fixed at receipt plus first installation, and record the reason for each rejection. A damaged seal, a wrong part number, and a machining flaw are three different supplier problems. Grouping them under one number hides the pattern that drives corrective action.
First-Pass Quality and Fleet Uptime
First-pass quality decides whether a repair closes on the first attempt. A defective unit at receipt forces a second order, a second shipment, and a second installation slot. The first-time fix rate falls, and the technician hour is spent twice. Fleet managers feel this directly, because a generator stays offline while the replacement travels.
This metric also protects customer satisfaction and the after sales relationship. A fleet that receives clean lots trusts the supplier with larger orders and longer commitments. A rising service contract renewal rate often follows a sustained low defect rate, since renewal decisions rest on repair history rather than sales promises. Warranty and return terms convert this quality signal into financial protection. A supplier offering a 90-day free return policy absorbs the cost of a bad unit, and that policy is only sustainable when defect rates stay low. Track Initial Defect Rate monthly within the aftermarket KPIs set, and pair it with the first-time fix rate to show the operational cost of poor first-pass quality.
KPI 3: Order Lead Time
Measuring From PO to Dock
Order Lead Time measures the elapsed time from purchase order issuance to dock receipt. The clock starts when the buyer releases the PO and stops when the shipment is checked in at the receiving dock. Every stage in between belongs in the measurement: supplier processing, packing, freight transit, and customs clearance where cross-border shipping applies. A supplier that quotes a fast production window but routes freight through a slow lane will show a long lead time on the scorecard.
Measure the full window, not just the supplier's internal processing time. Record the date of each milestone so the scorecard can separate supplier delay from carrier delay. Track the on-time delivery rate alongside the average, because a fast average can hide a long tail of late shipments. A supplier that hits the promised date most of the time is more useful than one with a slightly lower average and frequent misses.
Lead Time as Downtime Risk
Lead time functions as a direct downtime risk factor. A generator waiting on a replacement part stays offline for the entire order window, and every day of that window carries the same cost as an unplanned failure. Procurement teams should treat lead time as a risk multiplier on critical spare parts, not a convenience metric. The ratio of downtime to operating time rises with every late shipment on a reliability-critical component.
This is why Order Lead Time belongs among the operational efficiency KPIs. It shapes safety stock levels, technician scheduling, and the working capital tied up in buffer inventory. A shorter, more predictable lead time lets a fleet carry less stock and still meet availability targets. Track it monthly within the aftermarket KPIs set, and pair it with the otd figure to show both speed and reliability. Together, these operational efficiency KPIs give fleet managers a defensible basis for supplier conversations.
KPI 4: Inventory Turnover Ratio
Formula and Benchmarking Basics
The inventory turnover ratio shows how many times stock is sold or consumed in a period. The standard financial calculation is:
Inventory Turnover Ratio = Cost of Goods Sold (COGS) / Average Inventory
Average Inventory = (Beginning Inventory + Ending Inventory) / 2
COGS = Beginning Inventory + Purchases – Ending Inventory
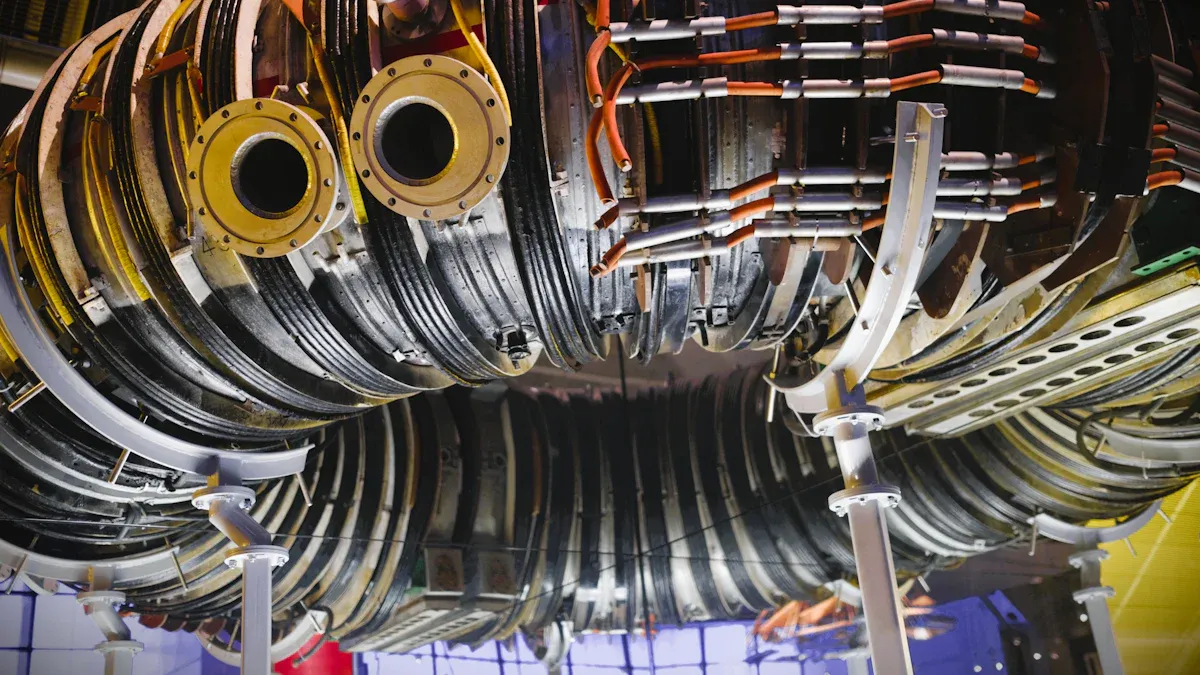
Benchmarks vary widely by sector. Broad industrial supply chain benchmarks report that heavy-duty and generator parts retailers average 3–5 turns annually, pulled down by extensive SKU counts and slow-moving specialty items. Other heavy-equipment sector studies place spare parts and aftermarket auto parts often well under 3 turns. A wider industrial comparison, shown below, reflects this constraint.
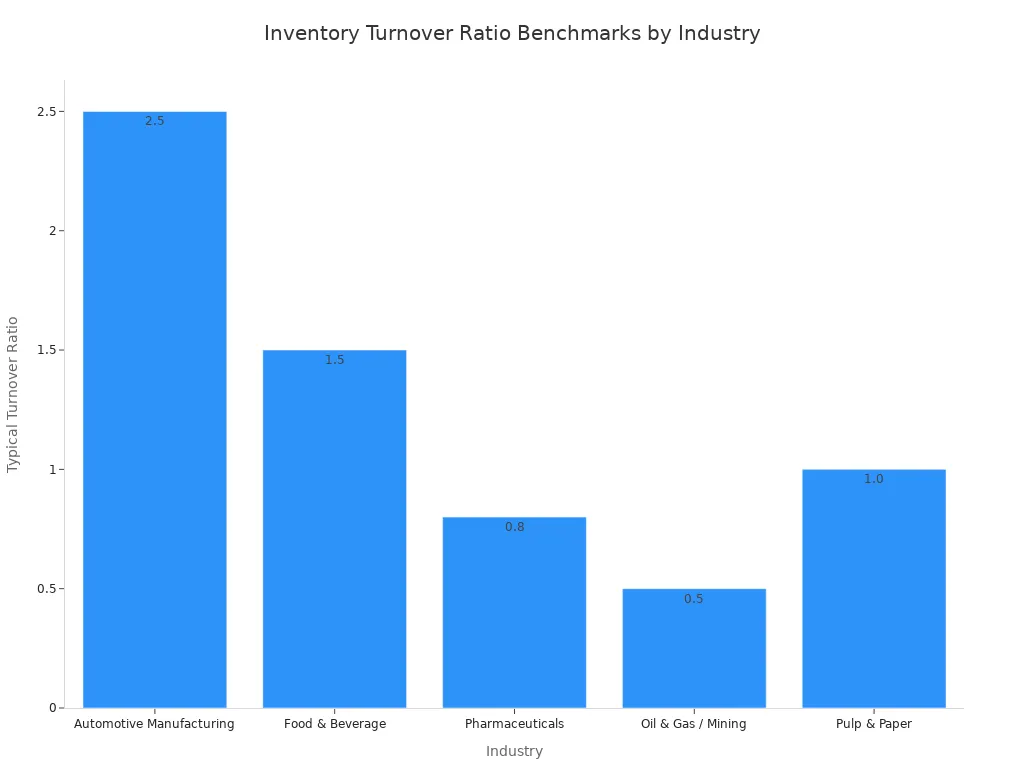
Financial analysts also warn that insurance spares drag the average down and recommends calculating turnover for consumables separately from capital spares. A ratio far above the benchmark can signal stockouts rather than efficiency.
Balancing Working Capital and Availability
High turnover frees working capital. Low turnover protects spare parts availability. The inventory turnover ratio sits between these goals, and the right balance depends on part criticality. Standard working capital management advises reviewing slow-moving stock regularly, questioning any part that has not moved in 12 months, and setting stock levels from consumption data rather than initial estimates.
Companion metrics keep the ratio honest. Obsolescence rate flags stock losing value on the shelf, and turn rate by tier shows where capital is trapped. Track both alongside the ratio within the aftermarket KPIs set, and review the results against fill rate and stockout frequency. This pairing turns a single number into a working capital decision.
Building an Aftermarket KPIs Scorecard

Weighting the Four Metrics
A scorecard works when the weights reflect part criticality. Reliability-critical components should carry the heaviest weighting on Mean Time Between Failures and Initial Defect Rate, because a failure on these items stops a generator. Order Lead Time deserves a strong weight on downtime-sensitive parts, where every day of waiting carries the same cost as an outage. The inventory turnover ratio matters most for high-volume consumables—such as engine oil and fuel filters—where working capital efficiency drives the parts business margin.
Business priorities adjust the baseline. A fleet focused on uptime may weight reliability metrics above all else. A procurement team under capital pressure may raise the turnover weight. Document the weights once, apply them consistently, and revisit them when fleet composition changes. The right KPIs for one fleet are not automatically the right KPIs for another.
Review Cadence and Accountability
A robust evaluation model uses a three-tier cadence rather than one fixed interval. Monthly KPI monitoring catches execution drift early, quarterly initiative reviews test whether resources still match strategic priorities, and an annual strategic plan review asks whether the strategy itself still fits. Skipping the monthly tier leaves quarterly reviews reconstructing what happened instead of deciding what to do next.
Accountability needs named owners. Effective accountability requires clear ownership: assign the scorecard and cadence to category management, findings to quality control, and delivery performance to logistics. Furthermore, sharing scorecards openly with vendors with vendors and setting improvement targets with timelines. A score with no bearing on allocation or renewal is a newsletter. Track the on-time delivery rate, the first-time fix rate, and each key performance indicator against its tier target, and the aftermarket KPIs become a management tool rather than a report.
How MARKT-PILOT Supports KPI Tracking
Pricing and Market Intelligence
A pricing and market intelligence platform extends the scorecard beyond operational metrics. The four core KPIs measure reliability, quality, speed, and capital efficiency. They do not measure whether the price paid for a spare part matches the market. Pricing and market intelligence KPIs close that gap. The platform benchmarks part pricing against comparable transactions and flags drift before it erodes aftermarket margin. This visibility supports the ratio of aftermarket margin to equipment margin, a figure that finance teams watch closely.
The platform also connects pricing data to the operational record. A supplier with strong MTBF results but prices above market becomes a negotiation case. A supplier with competitive pricing but a rising defect rate becomes a development case. Both conversations rest on evidence rather than impression. That discipline strengthens the parts business and protects profit margins across the aftermarket portfolio.
Data for Annual Procurement Reviews
Annual procurement reviews need a full year of consistent data. A platform consolidates pricing history, lead time records, and quality results into one view. Procurement directors can then rank suppliers on total performance rather than unit price alone. The review becomes a strategic exercise, and the aftermarket KPIs supply the evidence.
This is exactly where a strategic supply partner makes the difference. Megawatts Parts provides premium aftermarket and genuine parts for generator sets and construction machinery, meeting or exceeding OEM specifications for Cummins, Caterpillar, Kubota, Yanmar, Weichai, and Perkins. To directly support your Order Lead Time KPIs, our strategically located branches in China, Saudi Arabia, Colombia, and Nigeria drastically shorten the global supply chain. Furthermore, strict full-lot testing and a 90-day free return policy protect your Initial Defect Rate, ensuring the right parts arrive ready for immediate installation.
Purchase price is a starting data point, not a verdict. The 4 essential KPIs work as a set. MTBF shows reliability, Initial Defect Rate shows first-pass quality, Order Lead Time shows downtime risk, and Inventory Turnover Ratio shows capital discipline. Together they form a complete supplier performance picture.
Adopt the scorecard approach and review suppliers on a regular cadence. Per-transaction buying hides patterns that a rolling review exposes. Consistent quality, short lead times, and full-lot testing lower total cost of ownership across the aftermarket KPIs you track. These traits protect uptime and strengthen the parts business over time. Large accounts can submit annual procurement lists to Megawatts Parts for evaluation.
FAQ
Which KPI should a fleet manager track first?
Start with Mean Time Between Failures on reliability-critical parts. It links directly to uptime and carries the clearest commercial cost. Add Initial Defect Rate next, since first-pass quality shapes repair outcomes. Order Lead Time and Inventory Turnover Ratio follow once the reliability baseline is stable.
How often should the scorecard be reviewed?
Use a monthly cadence for operational metrics and a quarterly review for strategic weighting. Monthly checks catch execution drift early. Quarterly reviews test whether the weights still match fleet priorities. Annual procurement reviews then consolidate a full year of consistent data into supplier rankings.
What happens when a supplier fails one metric but performs well on others?
Treat the result by criticality tier. A weak MTBF score on a reliability-critical part outweighs strong pricing. A weak turnover ratio on a consumable is a working capital issue, not a downtime risk. Document the finding, set an improvement target, and revisit it at the next review.
Can a small fleet build a useful scorecard without dedicated software?
Yes. A simple spreadsheet works when the inputs stay consistent. Record operating hours, defect counts, PO dates, and dock dates from the same sources each period. Standardize the definitions once, then apply them without exception. Software helps at scale, but discipline matters more than tooling.
How does Megawatts Parts support an annual procurement review?
Megawatts Parts supplies aftermarket and genuine parts for generator sets and construction machinery, meeting or exceeding OEM specifications for brands such as Cummins, Caterpillar, Kubota, Yanmar, Weichai, and Perkins. Branches in China, Saudi Arabia, Colombia, and Nigeria shorten lead times. Full-lot testing and a 90-day free return policy support quality consistency. Large accounts can submit annual procurement lists for evaluation.
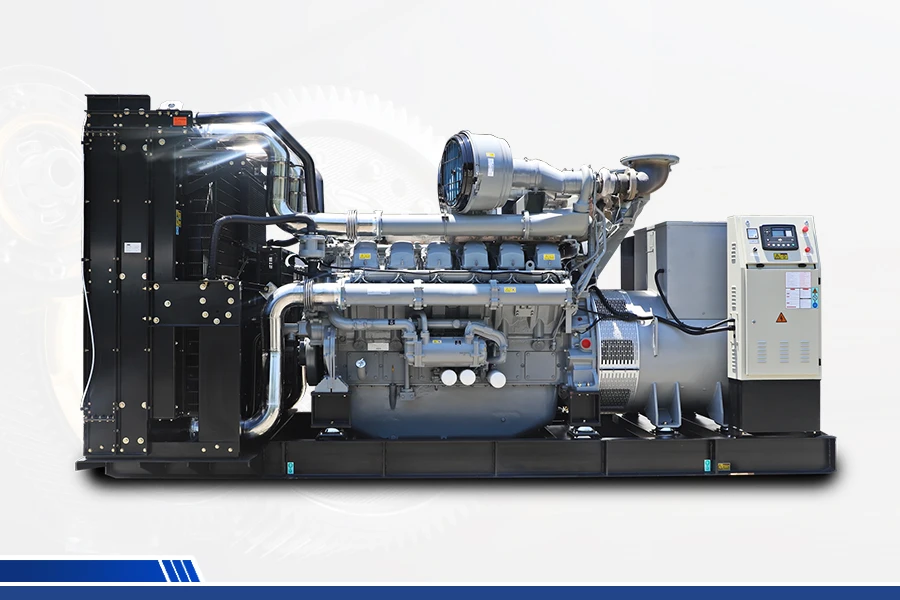
Read More
-
 BLOG
 Megawatts BlogOil Filter Bypass Valves Explained: How Cold Starts Affect Lubrication in Diesel EnginesCold oil is thick. It resists flow, so the oil pump works harder and pressure climbs. That pressure spike can push the bypass valve open, and unfiltered oil then travels through the engine. Picture...
-
 BLOG
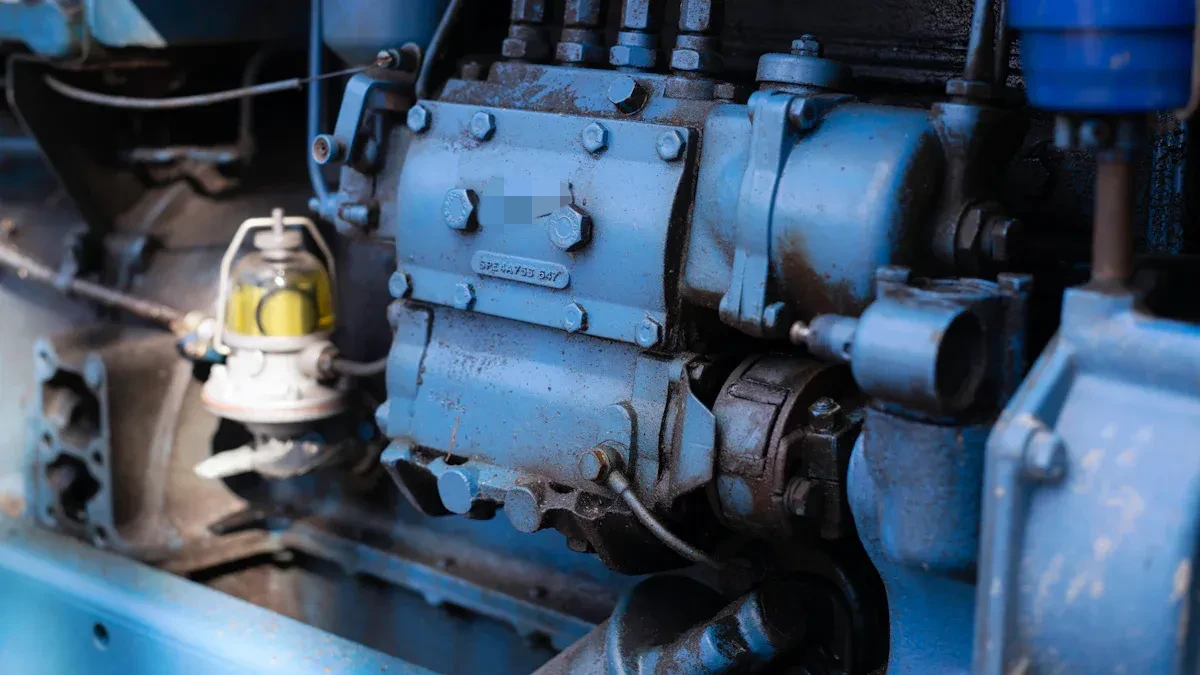
Megawatts BlogCharge Air Cooler Leaks: The Hidden Cause of High Exhaust Gas TemperaturesThe fuel filters are fresh, the injectors are clean, and the turbo checks out healthy. Yet exhaust gas temperature keeps climbing. Many technicians chase fuel delivery first, and that instinct often...
-
 BLOG
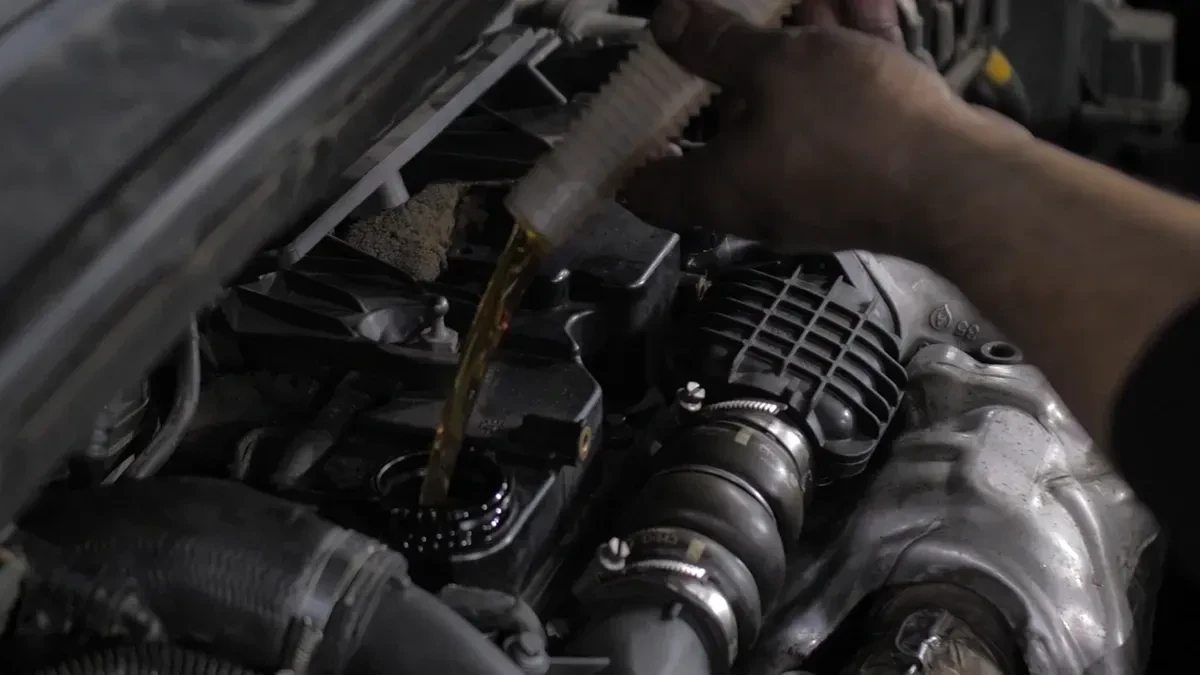
Megawatts BlogOil Pump Cavitation and Aeration in High-Hour Diesel Engines: Symptoms and SolutionsOil pump cavitation and aeration look alike on a gauge, yet they start differently. Cavitation means vapor bubbles form and collapse inside the pump. Oil aeration means air enters the oil stream and t...
-
 BLOG
Megawatts BlogDiagnosing Generator End Failures: Rotating Diodes and Rectifier Bridge TestingA generator that will not build voltage sends most technicians straight to the exciter circuit. The rotating diodes and the rectifier bridge belong at the top of that list. Both components are testabl...
Subscribe to enjoy 10% off
Stay informed about new products and sales

-
INFORMATION
Contact Us
-
CHINA SALES OFFICE: No. 2-11, No. 8, Gaotai Road, Gaishan Investment Zone, Cangshan District, Fuzhou, Fujian
-
SAUDI ARABIA FACTORY: 7264 Shakra, Al Faisaliyyah, REFB3035, 3035, Riyadh 12883
-
COLOMBIA SALES OFFICE: 92-32 26th Street, 03-118, Bogota
-
NIGERIA FACTORY: Plot 5 Chivita Avenue Ajao Estate Isolo Lagos
-
Email:sales@megawattsparts.com
Follow Us


Copyright © 2025 Megawatts All Rights Reserved.



Select Previous Button or Search Directly on Search Bar!
Shop All
 English
Currency: <{ pagedata.current_currency }>(<{ pagedata.current_currency_code }>)
Are you in the right place?

You agree to MegaWatts.com's Terms of Use and Privacy Policy by subscribing. You may receive emails with useful tips, promotions, and offerings.
No, thanks. I'd rather pay full price.