





















Total Cost of Ownership (TCO) in Fleet Maintenance: Hidden Logistics Costs of Sourcing Multiple OEMs
by Megawatts - Updated At 2026-10-13
What hidden logistics costs emerge when sourcing multiple OEMs? How heavily do they weigh on Total Cost of Ownership (TCO) in Fleet Maintenance? A fleet manager compares two identical parts at different prices. Unaware, the manager assumes the cheaper part wins. Its logistics burden, however, proves heavier. Separate supplier, separate freight waybill, separate customs clearance — each raises TCO.
Multi-OEM sourcing multiplies freight waybills, customs exposure, and tied-up capital; every factor drives TCO upward. Additional shipments complicate inventory, administration, and raise lifecycle TCO. This post breaks down every hidden cost. It then shows how a one-stop aftermarket supplier like Megawatts Parts can consolidate logistics and cut TCO.
What Is Total Cost of Ownership (TCO) in Fleet Maintenance?

Total cost of ownership (TCO) in fleet maintenance is a financial estimate that captures every expense of owning and operating heavy equipment and generator sets. It includes acquisition, fuel, maintenance, downtime, depreciation, licensing, and disposal, minus residual value. This figure reveals the true cost of an equipment fleet's operation over its lifecycle.
Beyond the Parts Invoice
The parts invoice represents a fraction of actual spending. Experienced fleet managers know that hidden costs — administrative overhead, procurement complexity, parts inventory, mechanic training, tooling, and downtime — often exceed the visible price tag. A technical consultant once noted that a fleet overlooked these indirect expenses for years. The result was a budget overrun that no one saw coming.
Overlooking these hidden costs causes fleet managers to underestimate true ownership cost. Profitability suffers. A TCO analysis corrects this by exposing every direct and indirect cost associated with fleet ownership and operation.
The Core Cost Layers of Fleet TCO
A complete TCO for an industrial asset includes several layers. Acquisition covers the purchase or lease price. Operating expenses include fuel, insurance, and licensing. Maintenance and repair costs accumulate over time. Downtime costs reflect lost productivity. Depreciation reduces asset value. Disposal or resale value offsets total spending.
For heavy machinery and industrial generator fleets, industry benchmarks show that initial capital expenditure (CAPEX) accounts for a fraction of the lifecycle cost. Fuel and DEF consumption dominate, often representing up to 60% of operating expenses. Routine maintenance, parts replacement, and technician labor consume another 15% to 20%. The hidden variable is unplanned downtime—when a critical generator fails, the cost of halted operations, emergency equipment rentals, and expedited freight can quickly eclipse the asset's original purchase price. These figures help maintenance directors see where money truly goes."
How to Calculate Total Cost of Ownership for Fleet Operations
The TCO Formula in Plain Terms
Calculating the total cost of ownership for fleet operations requires a structured approach. The formula combines initial costs, operating costs, maintenance and repair costs, downtime costs, then subtracts residual value. Rachel Schreider, GM Fleet Area Sales Manager, states the simple formula directly:
"The simple formula for TCO is: (Net acquisition cost + Fuel costs + Maintenance costs + Fees and taxes) – Residual value = TCO."
A complete TCO calculation also includes one-time costs like upfit and accessories, annualized operating costs like fuel and insurance, and residual value based on depreciation. Fleet managers should search for benchmarks typical for their industry and consult trade associations for TCO templates. Financial statements, budget reports, operational data, and vendor input all support a credible TCO analysis.
Where Multi-OEM Sourcing Distorts the Math
Lifecycle costing reveals what upfront purchase price hides. A fleet standardizing on one OEM simplifies every line item. Sourcing from multiple OEMs inflates each one. Duplicated inventories tie up capital across separate stockrooms. Varied maintenance procedures force technicians to learn different protocols. Extra technician training consumes budget and time. Warranty complexity fragments claims across vendors.
A technical consultant once observed a fleet managing five OEM relationships. Each vendor required separate reconciliation. Administrative hours tripled within a year. The fleet saved on unit prices but lost more to indirect costs. This pattern shows why calculating the total cost of ownership demands attention to direct and indirect costs. A disciplined TCO calculation exposes these distortions. Fleet managers can then calculate lifecycle costs accurately and make sourcing decisions based on total cost of ownership, not unit price alone.
Related Reading: Learn how to build a unified database to prevent these distortions in our guide to strategic sourcing for mixed fleets.
Hidden Logistics Cost #1 — Inventory Carrying Costs
Capital Tied Up in Multiple Stockrooms
Every dollar parked in a spare parts inventory is a dollar unavailable for fuel, payroll, or new equipment. Carrying costs compound this burden. Industry benchmarks place annual carrying cost at 20–30% of inventory value. That range covers storage, insurance, obsolescence, and the cost of capital itself. A fleet holding $500,000 in OEM-specific stock therefore absorbs a substantial hidden charge each year, even when no part moves.
Consider a fleet running three OEM brands. Three stockrooms hold three sets of slow-moving parts. Each location duplicates shelving, climate control, and security. Each location ties up capital that could fund a single consolidated depot. A technical consultant once reviewed a fleet in this exact position. The manager believed separate stockrooms improved response time. The carrying cost told a different story. A disciplined tco analysis exposes this pattern quickly.
Obsolescence and Shrinkage Across OEM Parts
Obsolescence quietly erodes inventory value. A part tied to one OEM becomes dead stock once that model leaves the fleet. Shrinkage adds further loss through damage, misplacement, and theft. These forces raise warehousing costs without any visible invoice.
20–30% of average maintenance storeroom inventory is obsolete or overstocked, tying up working capital at 12–18% annual carrying cost.
That figure should alarm any fleet manager. A target carrying cost of 15–20% of average inventory value keeps capital productive. A rate above 25% signals excessive carrying cost and justifies aggressive lean-inventory strategies. A rate below 15% may indicate understaffing risk instead. The right balance protects uptime without strangling cash flow. Reducing the number of OEM relationships directly shrinks this exposure. Fewer suppliers mean fewer stockrooms, less dead stock, and a lower tco across the fleet lifecycle.
Hidden Logistics Cost #2 — Order Processing and Administration
The Paperwork Multiplier of Multiple POs
Each additional OEM adds a fresh layer of paperwork. One supplier means one purchase order, one invoice, and one reconciliation entry. Three suppliers mean three of each. Five suppliers mean five. The work does not scale in a straight line, either. Every new vendor brings its own part numbers, payment terms, and portal logins. A buyer must learn each system and track each order separately.
A technical consultant once audited a fleet with six OEM accounts. The accounts payable team processed six invoice streams every month. A single missed credit note went unnoticed for two quarters. That error alone erased the savings from a negotiated unit price. This is how hidden costs quietly inflate tco. The parts look cheap on paper. The processing burden tells a different story.
Staff Hours Lost to Invoices and Returns
Administrative hours per supplier per month form a reliable cost line. The exact figure varies by fleet size and order volume. The pattern, however, holds: each vendor consumes staff time for order entry, invoice matching, and payment follow-up. A fleet with many suppliers spends a meaningful share of its procurement week on this work alone.
Returns and warranty claims fragment across vendors. Each OEM follows its own return window, claim form, and credit process. A technician who needs a replacement part may wait on three different approvals. Communication gaps slow repairs and raise downtime. A disciplined tco analysis captures these hours as real money. Fewer suppliers mean fewer invoices, fewer disputes, and a lower tco. Consolidation turns administrative drag into measurable savings for the fleet.
Hidden Logistics Cost #3 — Transportation and Freight
Multiple Waybills and Minimum Order Penalties
Sourcing from several OEMs produces several international freight waybills. One consolidated shipment becomes three or four separate bookings. Each booking carries its own freight rate, handling fee, and documentation charge. The per-unit freight cost rises even when the total weight stays the same. A fleet manager who compares only the parts price never sees this difference. The tco does.
Minimum order penalties punish small, fragmented shipments. An OEM will not release a short order without a surcharge. The buyer then faces a choice. Pay the penalty, or wait and risk a stockout. Expedited freight adds another premium when a critical part runs short. A technical consultant once watched a fleet pay an expedited freight premium on a single water pump. The premium exceeded the pump's purchase price. That single event raised the tco for the whole repair cycle.
The True Cost of Split Deliveries
Split deliveries erode freight efficiency. A full container or truckload spreads fixed costs across many parts. A partial load spreads the same costs across few. The result is a higher freight cost per part, even at identical rates. Industry benchmarks place freight and logistics at a meaningful share of total parts spend, and fragmented sourcing pushes that share higher.
Partial loads and split deliveries can consume a double-digit percentage of parts spend once minimum order penalties and expedited premiums are counted.
A disciplined tco analysis captures these charges as real money. Fewer suppliers mean fewer waybills, fuller loads, and a lower tco. Consolidation turns freight from a hidden drain into a controlled line item for the fleet.
Hidden Logistics Cost #4 — Customs Clearance and Cross-Border Delays

Duty, Brokerage, and Demurrage Exposure
Every separate OEM shipment crossing a border triggers its own customs entry. Each entry carries duty, brokerage fees, and documentation charges. A fleet sourcing from three OEMs abroad pays three sets of these costs. The per-part customs burden rises even when the total shipment value stays constant. A single consolidated shipment spreads these fixed charges across all parts. Fragmented sourcing multiplies them.
Demurrage charges add another layer of exposure. Customs officials levy demurrage when cargo sits at a port beyond the free period. A delayed clearance means the container waits. The meter runs. A technical consultant once reviewed a fleet that paid demurrage on four separate containers in one quarter. Each container held parts from a different OEM. The combined demurrage exceeded the freight savings from splitting the orders. This pattern inflates tco in ways that unit price comparisons never reveal.
Downtime When Clearance Stalls a Critical Part
Clearance delays connect directly to vehicle downtime costs. A critical part held at customs means a generator or machine sits idle. The fleet loses productivity every hour that asset remains unavailable.A tco analysis must capture this lost productivity as a real expense.
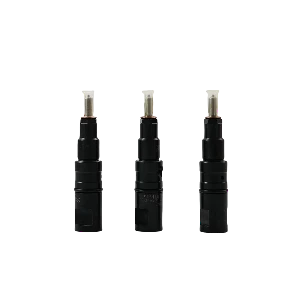
Consider a generator set awaiting a replacement fuel injector. The part ships from an overseas OEM. Customs officials flag the shipment for additional inspection. Days pass. The generator remains offline. The fleet pays for rental equipment to cover the gap. Labor sits idle. The injector's purchase price looks modest. The true cost includes rental fees, lost output, and administrative time spent chasing the shipment. A disciplined tco calculation exposes this hidden burden. Fewer suppliers mean fewer customs entries, faster clearance, and lower tco across the fleet lifecycle.
Hidden Logistics Cost #5 — Supplier Management Overhead
Maintaining Multiple OEM Relationships
Every OEM relationship carries a management cost. Contracts need negotiation and renewal. Contacts change without notice. Performance reviews demand time and data. A fleet with five OEM accounts performs this work five times over. The procurement team tracks delivery metrics, quality trends, and pricing terms for each vendor separately. No single dashboard shows the full picture.
A technical consultant once reviewed a fleet with seven active OEM accounts. The procurement lead spent most of each week on vendor correspondence alone. Contract renewals overlapped. Performance data sat in separate spreadsheets. The fleet had no consolidated view of supplier reliability. This administrative drag raises tco in ways that never appear on a parts invoice. Fewer vendors mean fewer contracts, fewer reviews, and a lower tco.
Warranty, Returns, and Communication Gaps
Warranty claims fragment across vendors. Each OEM follows its own claim window, form, and approval chain. A failed part may qualify for credit under one vendor and face rejection under another. Return policies vary just as widely. One supplier accepts returns within a set period. Another charges a restocking fee. A third requires photographic evidence before approval.
Communication gaps slow repairs and raise downtime. The generator sits idle. A tco analysis must capture this lost productivity as a real expense. A disciplined tco calculation treats supplier management as a measurable cost line. Consolidation reduces the number of relationships to manage. One supplier means one warranty process, one return policy, and one point of contact. That simplicity protects uptime and lowers tco across the fleet lifecycle.
How Hidden Costs Inflate Total Cost of Ownership in Fleet Operations
Compounding Effects Across the Lifecycle
The five hidden logistics costs do not strike once. They compound across every year an asset stays in service. A fleet manager who treats them as one-time expenses misses the full picture of total cost of ownership in fleet operations.
Consider how these costs multiply. Unplanned downtime costs an estimated $500 to $1,500 per generator per day. A two-day prime power outage can mean thousands in lost revenue and operational penalties, far above the repair bill itself. Reactive maintenance costs three to nine times more than preventive maintenance. Each dollar spent on planned service saves three to nine dollars on emergency repairs. These savings compound annually as equipment ages.
|
Hidden Cost Factor |
Compounding Mechanism |
Supporting Figure |
|
Reactive maintenance |
Emergency repairs cost multiples of planned service |
3–9 times preventive maintenance cost |
|
Equipment downtime |
Lost productivity accrues daily during outages |
$500–$1,500+ per asset per day |
|
Aging equipment costs |
Cost per operating hour rises sharply after 10,000 hours |
35% increase for assets over 10 years old |
|
Rental replacement |
Expenses stack during extended downtime |
Up to $3,000 per month |
A preventive maintenance program delivers an average 545% return on investment and cuts overall maintenance spending by 20 to 30 percent. These figures demonstrate why calculating the total cost of ownership demands a lifecycle view. The cheapest part rarely produces the lowest total cost of ownership once freight, customs, inventory, and administrative burdens accumulate.
A Framework to Quantify Your Multi-OEM Burden
Fleet managers can measure their own multi-OEM exposure through a simple audit. This framework converts hidden costs into visible numbers.
Start by listing every active OEM supplier. Record the number of purchase orders, invoices, and warranty claims each vendor generates monthly. Map every freight waybill from the past quarter. Note each separate shipment, its origin, and its customs entry. Tally the capital tied up in OEM-specific inventory across all stockrooms. Apply the annual carrying cost percentage to that figure. Count the staff hours spent on vendor correspondence, invoice reconciliation, and return processing.
This tco analysis reveals direct and indirect costs that unit price comparisons hide. A disciplined tco calculation treats every hour and every waybill as a real expense. Fleet managers who calculate the total cost of ownership for your fleet operations gain the data needed to consolidate suppliers and reduce hidden costs. The goal is not the lowest parts price. The goal is the lowest total cost of ownership across the fleet lifecycle.
Strategies to Reduce Hidden Logistics Costs and Lower TCO
Consolidation, Standardization, and Vendor Rationalization
Three levers reduce hidden logistics costs. Consolidation combines orders into fewer shipments. Standardization aligns parts across similar equipment. Vendor rationalization trims the supplier list to essential partners. Each lever attacks a different cost layer.
Vendor consolidation delivers volume discounts of 8 to 15 percent. An industrial facility operating 50 heavy-duty generator sets and spending $180,000 annually on consumables can easily save $14,400 to $27,000 just on unit prices. However, the true savings appear in logistics. By transitioning to just-in-time (JIT) ordering aligned with actual preventive maintenance schedules, operations can cut inventory carrying costs by 25 to 35 percent. One mining contractor operating a mixed fleet of Cummins and Caterpillar engines consolidated their aftermarket sourcing from four vendors to two. By eliminating redundant freight waybills, expedited shipping premiums, and excess safety stock, their annual logistics and maintenance overhead fell by nearly 30 percent.
Why a One-Stop Aftermarket Supplier Cuts TCO
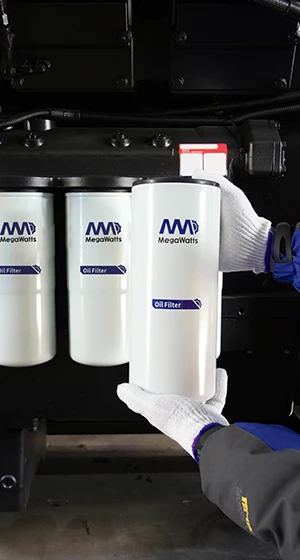
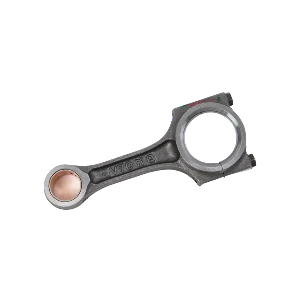
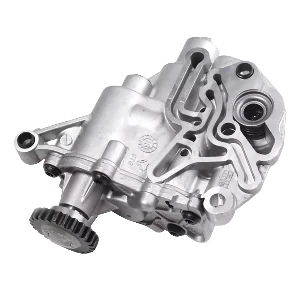
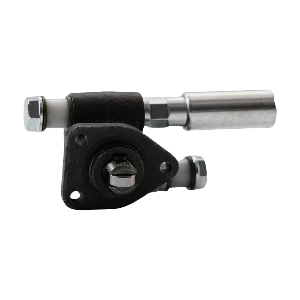
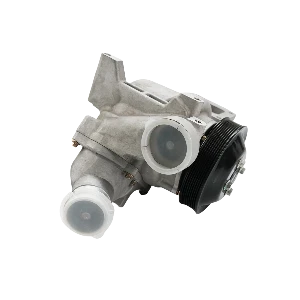
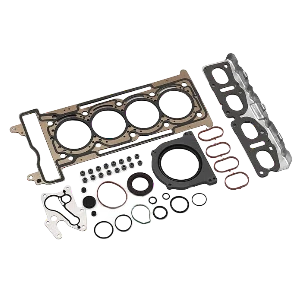
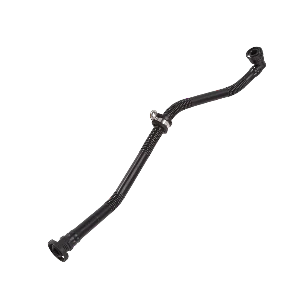
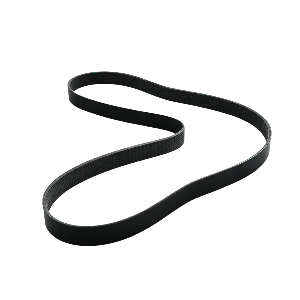
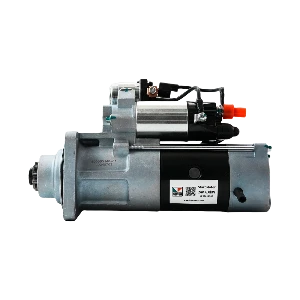
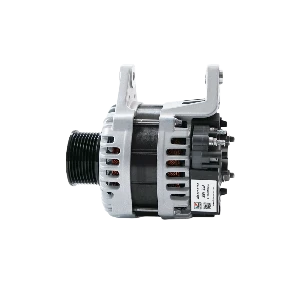
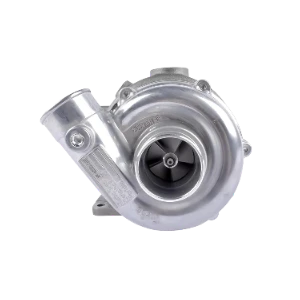
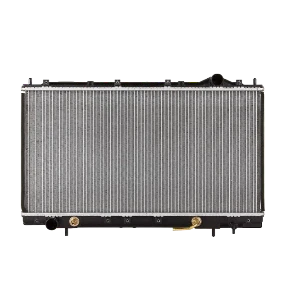
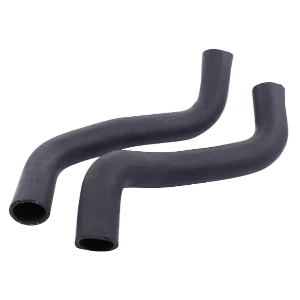
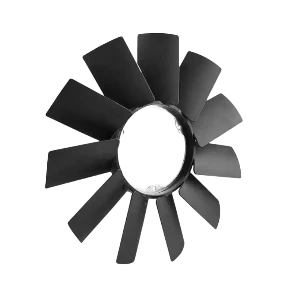
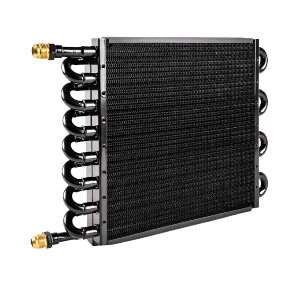
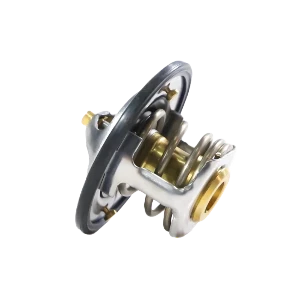
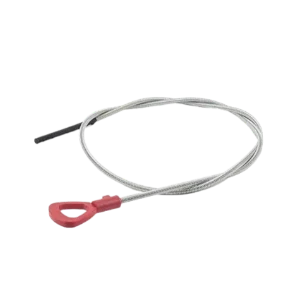
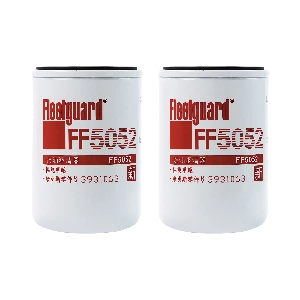
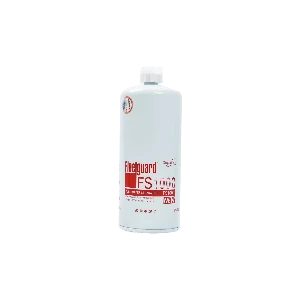
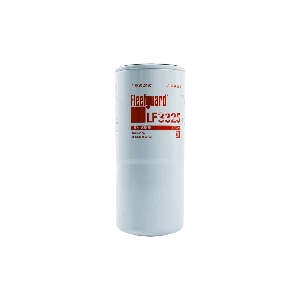
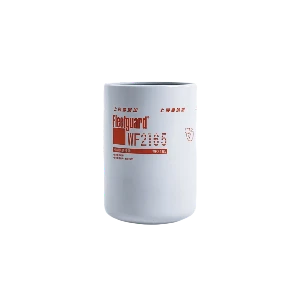
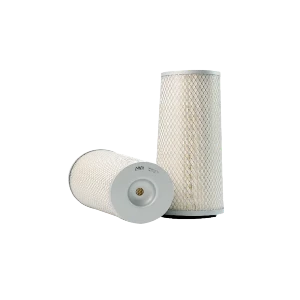
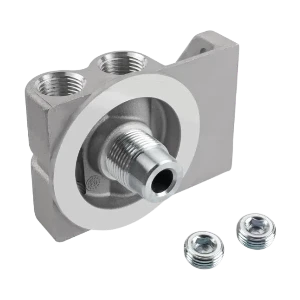
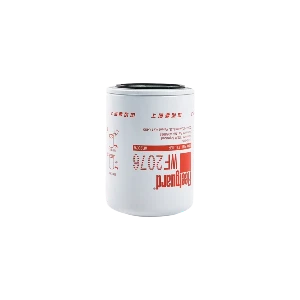
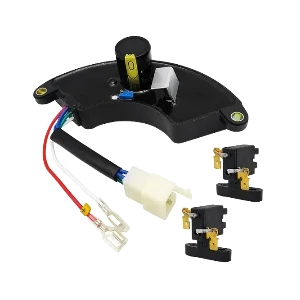
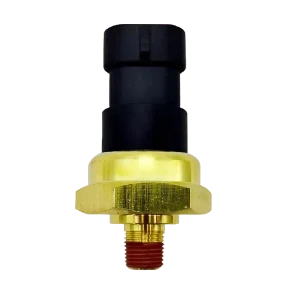
Megawatts Parts operates as a one-stop aftermarket supplier for generator sets and construction machinery. The company offers a comprehensive range of high-quality components designed to meet or exceed OEM specifications. Engine parts include cylinder liner and piston kits, engine bearings, bushings, connecting rods, valves, oil pumps, fuel pumps, water pumps, fuel injectors, gasket seal kits, fuel pipes, engine belts, starting motors, alternators, turbochargers, generator radiators, radiator hoses, fans, oil coolers, thermostats, and oil dipsticks. Our comprehensive engine filter selection covers fuel filters, fuel water separators, oil filters, coolant filters, air filters, filter bases, and water filters. Generator components include alternators, AVRs, sensors, and breakers.
Global branches in China, Saudi Arabia, Colombia, and Nigeria enable consolidated freight and faster regional delivery. One supplier means one freight stream instead of multiple waybills. One inventory pool replaces separate stockrooms. One point of accountability simplifies administration.
Megawatts parts remain compatible with top brands including Baudouin, Caterpillar, Cummins, Deutz, Donaldson, Doosan, FAWDE, Fleetguard, Komatsu, Kubota, Leroy Somer, Lister Petter, Mitsubishi, MTU, MWM, Perkins, SME, Stamford, Volvo, Weichai, and Yanmar. This compatibility allows fleets to source from one vendor without sacrificing equipment coverage.
A 90-day free return policy reduces risk. Live customer support resolves issues quickly. These service advantages lower downtime and support a lower total cost of ownership. A disciplined tco calculation should include these service benefits. Fleet managers who calculate the total cost of ownership across all suppliers will find that consolidation with Megawatts Parts reduces hidden logistics costs. The result is a lower total cost of ownership and stronger fleet performance.
Five hidden logistics costs quietly inflate total cost of ownership: inventory carrying costs, order administration, freight, customs clearance, and supplier management. Each one raises total cost of ownership beyond the parts price. The cheapest part rarely delivers the lowest total cost of ownership once freight, customs, inventory, and admin are counted. Audit your multi-OEM footprint with the framework above. Megawatts Parts offers one supplier, one freight stream, one inventory pool, and one point of accountability. Make total cost of ownership, not unit price, the deciding metric in fleet parts sourcing. That shift lowers TCO, protects uptime, and strengthens every fleet budget. Let TCO guide your next sourcing decision.
FAQ
These questions address the logistics costs that quietly inflate tco across a fleet, drawn from field experience and maintenance benchmarks.
How do multiple OEM suppliers inflate tco through freight and customs costs?
Each supplier generates a separate waybill and customs entry. A consolidated shipment spreads freight charges across more parts. Fragmented sourcing multiplies fixed costs. Demurrage risk rises when a container stalls at port. This burden never appears on invoices, yet raises tco. Ignoring freight understates the true total cost of ownership.
What does carrying multi-OEM inventory cost your tco?
Carrying cost runs 20–30% of inventory value. Three OEM brands mean three stockrooms and three sets of parts. Capital sits idle while obsolescence erodes value. A consultant found a fleet paying more in carrying than it saved on unit price. That gap inflates total cost of ownership — tco leak.
How does a one-stop aftermarket supplier reduce total cost of ownership?
Megawatts Parts consolidates freight, customs entries, inventory pools, and administrative work into one stream. The 90-day free return policy and live customer support reduce downtime. Global branches in China, Saudi Arabia, Colombia, and Nigeria speed regional delivery. Fewer suppliers mean fewer claim forms. A disciplined tco analysis captures these savings.
Why do customs delays raise tco beyond the purchase price?
Each hour a part waits at customs, critical equipment sits idle. Downtime can cost $500 to $1,500 per asset per day. Rentals stack expense. Demurrage multiplies. These losses never appear on an invoice. True total cost of ownership includes every idle hour. Any complete tco analysis must count this.
What is the quickest way to audit a fleet's multi-OEM tco burden?
List every active supplier. Count monthly purchase orders, invoices, and warranty claims per vendor. Map freight waybills from the past quarter. Tally inventory value across stockrooms, then apply the 20–30% carrying cost rate. Add vendor correspondence hours. The audit exposes the true total cost of ownership and hidden tco.
Read More
-
 BLOG
BLOG Megawatts BlogAnatomy of a Breakdown: Warning Signs Your Engine Driven Water Pump is Failing Before It LeaksAn engine-driven water pump typically broadcasts failure well before it drips. The pre-leak danger window is that brief period when noise, odor, temperature swings, or residue appear but no puddle for...
 -
 BLOG
Megawatts BlogStrategic Sourcing: How to Build a Standardized Generator Sets Parts Catalog for Mixed FleetsManaging a mixed fleet of Cummins, Perkins, and Caterpillar generators often creates a hidden financial drain through inventory duplication and fragmented procurement. When different brands use differ...
BLOG
Megawatts BlogStrategic Sourcing: How to Build a Standardized Generator Sets Parts Catalog for Mixed FleetsManaging a mixed fleet of Cummins, Perkins, and Caterpillar generators often creates a hidden financial drain through inventory duplication and fragmented procurement. When different brands use differ... -
 BLOG
Megawatts BlogDiesel Generator Won't Crank: A Step-by-Step Electrical Diagnostic Checklist for MechanicsWhen a diesel generator won't crank, check the electrical system first. Do not chase fuel or mechanical theories yet. Low battery voltage and corroded connections cause most no-start condition calls....
BLOG
Megawatts BlogDiesel Generator Won't Crank: A Step-by-Step Electrical Diagnostic Checklist for MechanicsWhen a diesel generator won't crank, check the electrical system first. Do not chase fuel or mechanical theories yet. Low battery voltage and corroded connections cause most no-start condition calls.... -
 BLOG
Megawatts BlogMagnetic Coil Degradation: Why Your Diesel Engine Stop Solenoid Fails Under Extreme HeatExtreme heat is the primary enemy of a diesel engine stop solenoid. The heat breaks down the electrical insulation inside the magnetic coil. This degradation raises resistance and creates short circui...
BLOG
Megawatts BlogMagnetic Coil Degradation: Why Your Diesel Engine Stop Solenoid Fails Under Extreme HeatExtreme heat is the primary enemy of a diesel engine stop solenoid. The heat breaks down the electrical insulation inside the magnetic coil. This degradation raises resistance and creates short circui...
Subscribe to enjoy 10% off
Stay informed about new products and sales

-
INFORMATION
Contact Us
-
CHINA SALES OFFICE: No. 2-11, No. 8, Gaotai Road, Gaishan Investment Zone, Cangshan District, Fuzhou, Fujian
-
SAUDI ARABIA FACTORY: 7264 Shakra, Al Faisaliyyah, REFB3035, 3035, Riyadh 12883
-
COLOMBIA SALES OFFICE: 92-32 26th Street, 03-118, Bogota
-
NIGERIA FACTORY: Plot 5 Chivita Avenue Ajao Estate Isolo Lagos
-
Email:sales@megawattsparts.com
Follow Us


Copyright © 2025 Megawatts All Rights Reserved.



Select Previous Button or Search Directly on Search Bar!
Shop All
 English
Currency: <{ pagedata.current_currency }>(<{ pagedata.current_currency_code }>)
Are you in the right place?

You agree to MegaWatts.com's Terms of Use and Privacy Policy by subscribing. You may receive emails with useful tips, promotions, and offerings.
No, thanks. I'd rather pay full price.